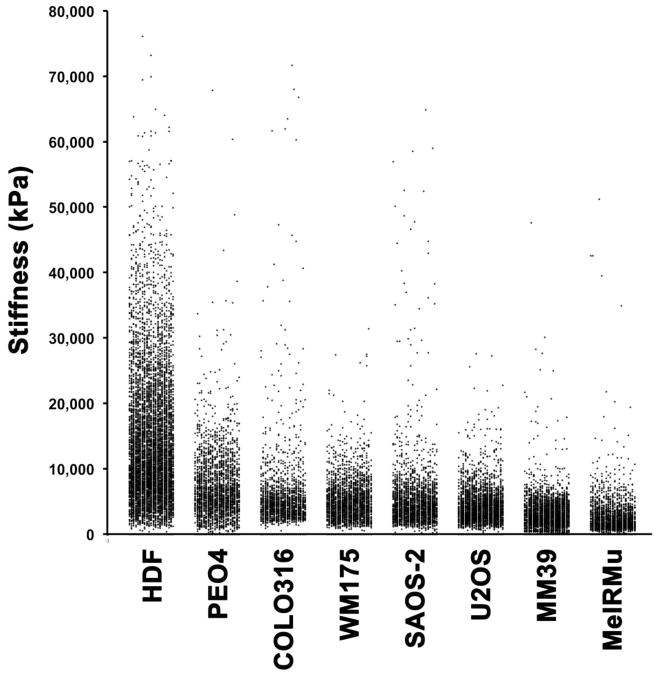
Fig. 6.
Scattergrams of stiffness measurements made for all cell lines studied at or above 0.8 μm height, and arranged in order of decreasing median stiffness value. There appeared to be good correlation between median stiffness values (Table 1) and the general central tendency of data clouds for each cell line studied. However, the range of stiffness values measured within individual cell lines varied greatly.

