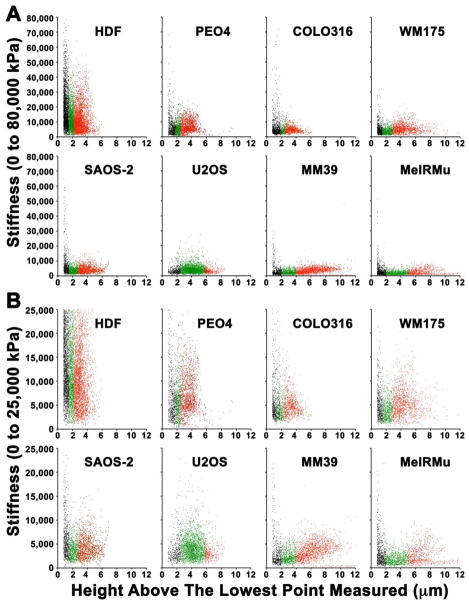
Fig. 7.
Scattergrams of data collected at or above 0.8 μm height, plotting height against stiffness up to 80,000 kPa to permit inspection of the full range of data (A), as well in the restricted range of from 0 kPa to 25,000 kPa (B) to better visualize results for lower stiffness values. Height measurements correlated loosely with stiffness values, such that the highest stiffness values were seen at low height measurements (black scatter marks), with a second broad peak in stiffness (red scatter marks) occurring after an intervening trough (green scatter marks). The exception to this was in U2OS, where stiffness was maximal in the mid region of height measurements (green scatter marks).

