
Figure 2.
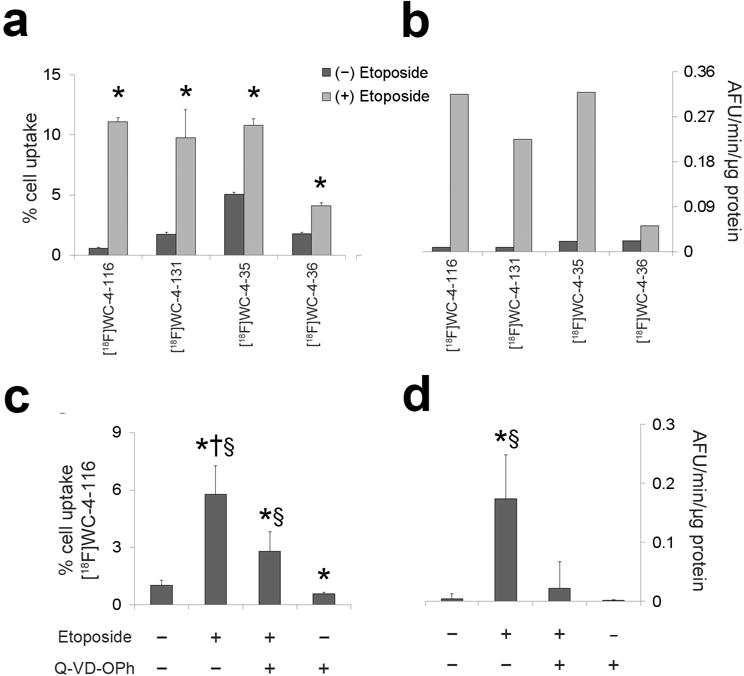
Cell uptake assays with radiolabeled isatins in EL4 murine lymphoma cells with or without etoposide (20 μg/ml). a Uptake for representative second ([18F]WC-4-116 and [18F]WC-4-131) and third ([18F]WC-4-35 and [18F]WC-4-36) generation tracers b and caspase-3 enzyme activity were assessed in EL4 cells with and without etoposide (20 μg/ml). c [18F]WC-4-116 uptake and d caspase-3 activity was additionally assessed in the presence or absence of the pan-caspase inhibitor Q-VD-OPh (bottom left panel). % cell uptake = percent of added activity measured in the cells normalized to 106 viable cells. AFU/min/μg protein = Arbitrary fluorescence units per minute per μg of protein. * p < 0.05 compared to untreated control. † p < 0.05 compared to etoposide+Q-VD-OPh. § p < 0.05 compared to Q-VD-OPh alone. The data were log-transformed for statistical testing; the actual values are shown in the graphs. The data are expressed as mean with standard deviation error bars. No error bars are shown in b because the protein samples at each time point were pooled to measure the caspase-3 activity for these experiments, thus yielding only two measurements to average.