
Figure 3.
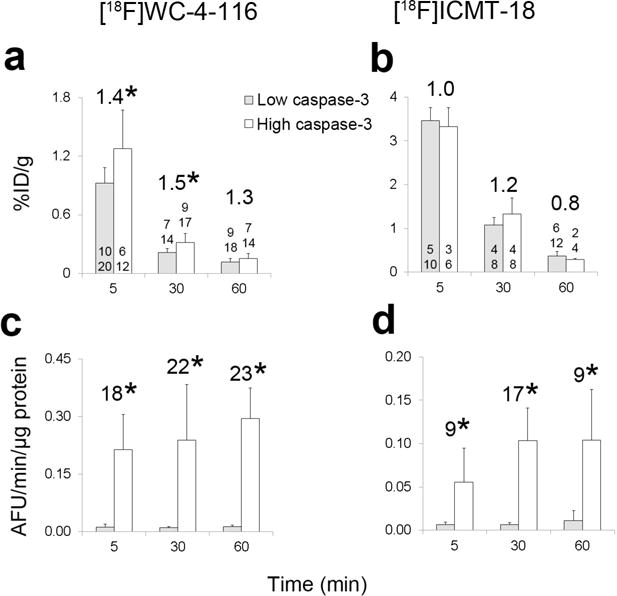
Biodistribution study results with [18F]WC-4-116 (caspase-3 targeted) or [18F]ICMT-18 (non-caspase-3 targeted) tracers. Both the percent injected dose per gram (%ID/g) of tracer (a, b) and caspase-3 enzyme activity (c, d) were determined in each tumor. The number of mice (top) and number of tumors (bottom) are listed at the base of or just above each bar. The fold-change in the mean value of the high vs low caspase-3 groups is listed as the larger number above the bars. In the [18F]ICMT-18 biodistribution study, a high outlier (2.2 %ID/g) in the 30 min high caspase-3 activity group was included in the analysis and in the graph. The fold-change between high and low caspase-3 activity groups was 1.1 without this high outlier. * p < 0.05.