
Figure 4.
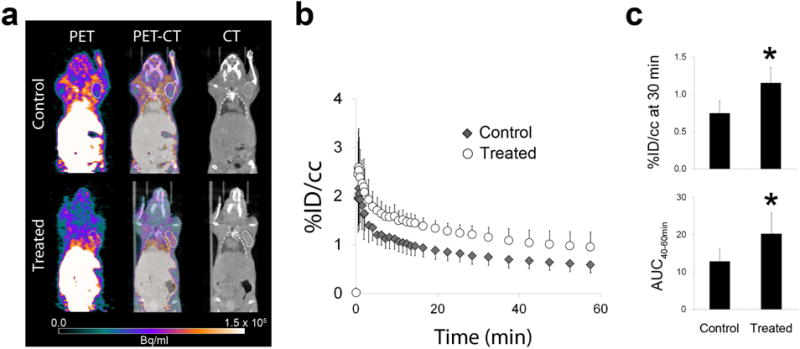
MicroPET imaging results. a Representative transaxial microPET (last 5 min of acquisition) and CT images, b time-activity curves, and c [18F]WC-4-116 uptake quantified as the % injected dose per cc (% ID/cc) at 30 min and the area under the curve from 40-60 min (AUC40–60min) are shown for N = 6 mice, N = 12 tumors per treatment group. The second tumor in the M413-treated mouse is not visible on this transaxial slice. The averaged time activity curves in the tumors are represented as the mean percent injected dose per cc of tumor (%ID/cc) with standard deviation bars. * p < 0.001.