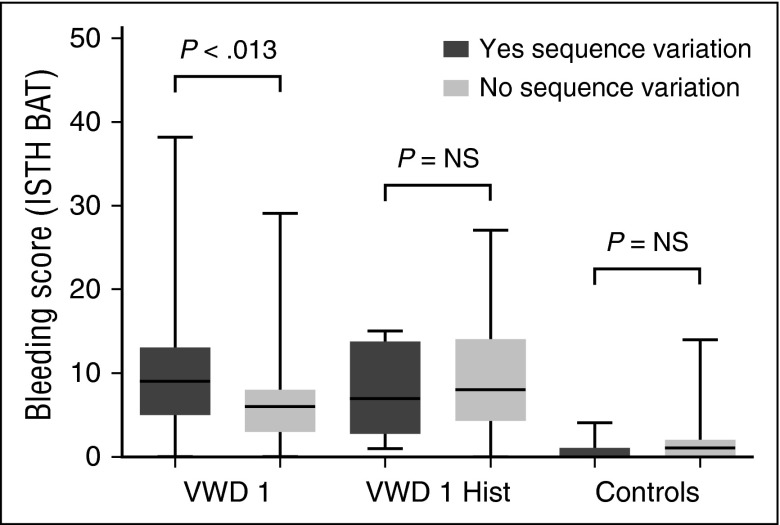
Figure 3.
Correlation of sequence variations with BS. This box and whisker plot compares BS using the ISTH BAT for adult subjects (≥18 years of age) with type 1 VWD (VWF:Ag and/or VWF:RCo below the lower limit of normal at study entry) in the first pair of columns (“VWD 1”), those with a historical diagnosis of type 1 VWD but normal laboratory findings at study entry in the second pair of columns (“VWD 1 Hist”), and a comparison group of healthy control subjects in the third pair of column (“Controls”). Those subjects with a sequence variation are shown in dark gray, whereas those without a sequence variation are shown in light gray. There was no significant difference in BS between those with and those without a sequence variation for the historical type 1 cohort, and a borderline significant difference for the type 1 VWD cohort. NS, not significant.

