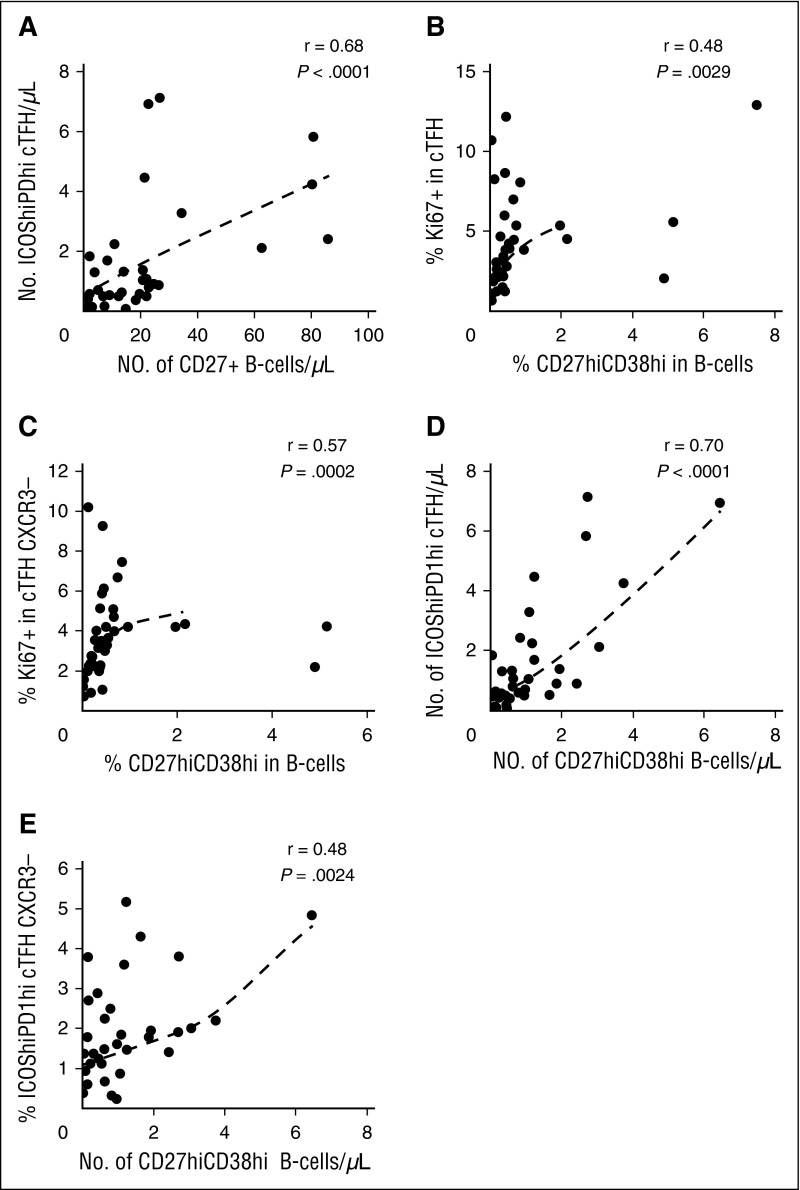
Figure 5.
cTFH signature correlates with plasmablast generation in patients with cGVHD (N = 38). (A) Correlation between number of activated cTFH (ICOShiPD-1hi CXCR5+CD45RA−CD4+ T cells) and number of circulating CD27+ B cells in patient samples. (B) Correlation between cTFH proliferation (%Ki67) and percentage of plasmablasts (CD27hiCD38hi) in patient samples. (C) Correlation between proliferation (%Ki67) of CXCR3− cTFH and percentage of plasmablasts (CD27hiCD38hi) in patient samples. (D) Correlation between number of activated cTFH (ICOShiPD-1hi) and number of plasmablasts (CD27hiCD38hi) in patient samples. (E) Correlation between percentage of activated CXCR3− cTFH (ICOShiPD-1hi) and number of plasmablasts (CD27hiCD38hi) in patient samples. The Spearman test was used.

