
Fig A3.
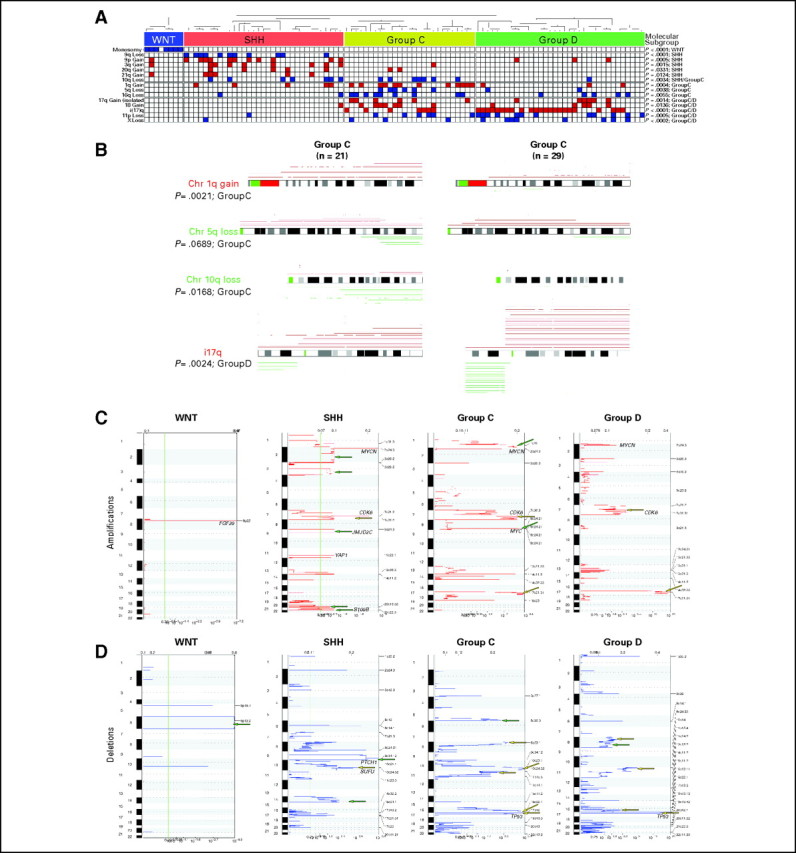
(A) Distribution of statistically significant, subgroup-specific copy number aberrations identified by manual curation of our medulloblastoma series. Significance was determined by Fisher's exact test. Blue boxes indicate loss/deletion, red boxes indicate gain/amplification, and white boxes denote balanced copy number state for the specified genomic aberration. (B) Comparison of statistically significant copy number aberrations over-represented in group C and group D medulloblastomas. Significance was determined by Fisher's exact test. (C, D) Genomic Identification of Significant Targets in Cancer analysis of the four medulloblastoma subgroups represented in our data series. Significance plots show regions of statistically significant (C) gains/amplifications and (D) losses/deletions in the medulloblastoma subgroups. Yellow arrows indicate copy number aberrations restricted to a single subgroup, and green arrows mark regions that are significant in multiple subgroups. Loci marking select candidate genes are shown for reference.