
Figure 1.
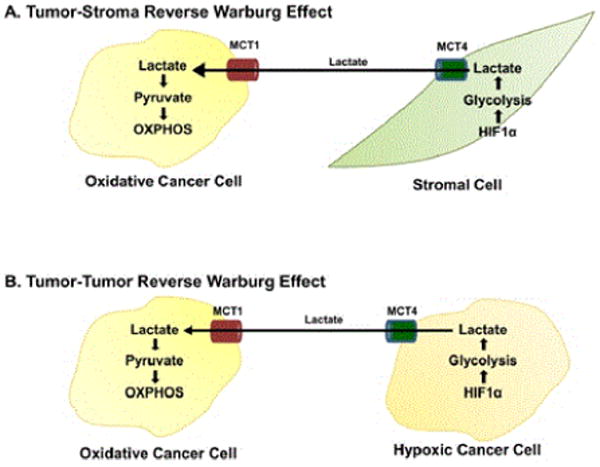
Diagram depicting the reverse Warburg effect in cancer cells and stromal cells (OXPHOS = oxidative phosphorylation, HIF1alpha = hypoxia-inducible factor 1-alpha, MCT1 = monocarboxylate transporter, MCT4 = monocarboxylate transporter 4).
Official websites use .gov
A
.gov website belongs to an official
government organization in the United States.
Secure .gov websites use HTTPS
A lock (
) or https:// means you've safely
connected to the .gov website. Share sensitive
information only on official, secure websites.
Diagram depicting the reverse Warburg effect in cancer cells and stromal cells (OXPHOS = oxidative phosphorylation, HIF1alpha = hypoxia-inducible factor 1-alpha, MCT1 = monocarboxylate transporter, MCT4 = monocarboxylate transporter 4).