
Figure 2.
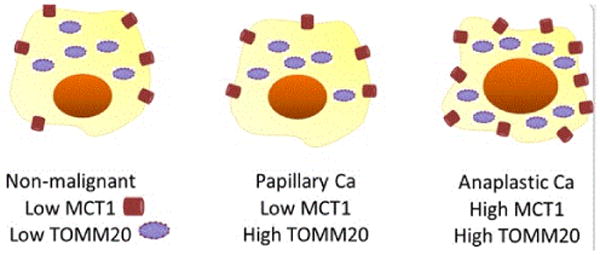
Illustration depicting low MCT1 and TOMM20 in non-malignant thyroid tissue, low MCT1 and high TOMM20 in PTC, and high MCT1 and TOMM20 in ATC.
Official websites use .gov
A
.gov website belongs to an official
government organization in the United States.
Secure .gov websites use HTTPS
A lock (
) or https:// means you've safely
connected to the .gov website. Share sensitive
information only on official, secure websites.
Illustration depicting low MCT1 and TOMM20 in non-malignant thyroid tissue, low MCT1 and high TOMM20 in PTC, and high MCT1 and TOMM20 in ATC.