
Figure 11.
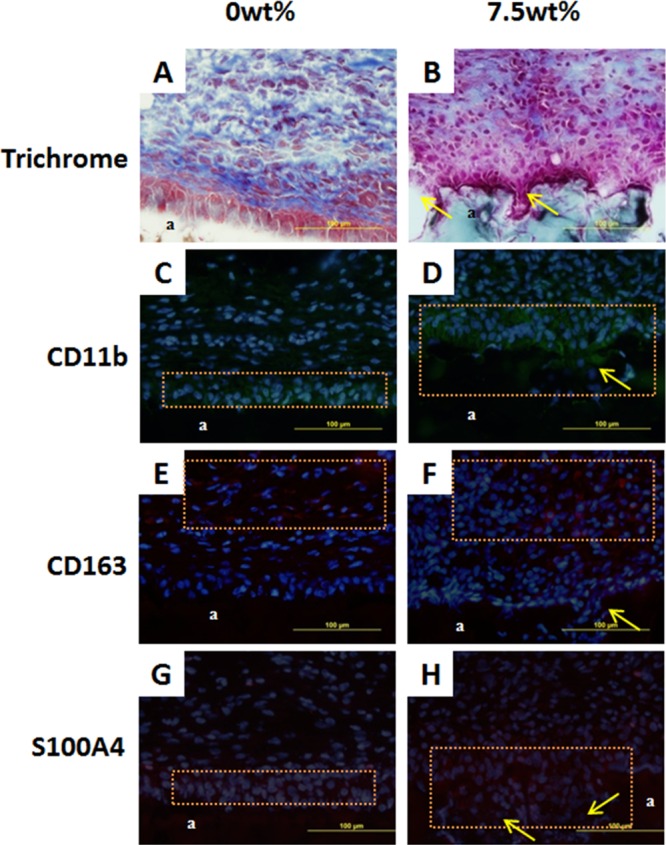
Masson’s trichrome stain (A, B) and immunofluorescent stain (C–H) of 0 and 7.5 wt % adhesive and surrounding tissue after 2 weeks subcutaneous implantation. a: adhesive. Orange box: cell distribution area. Single headed arrow: cell infiltrating into the pocket formed via gelatin microgel degradation. Blue (DAPI): cell nuclei. Green (CD11b): macrophage. Red (CD163 and S100A4): M2 macrophage and fibroblast, respectively.