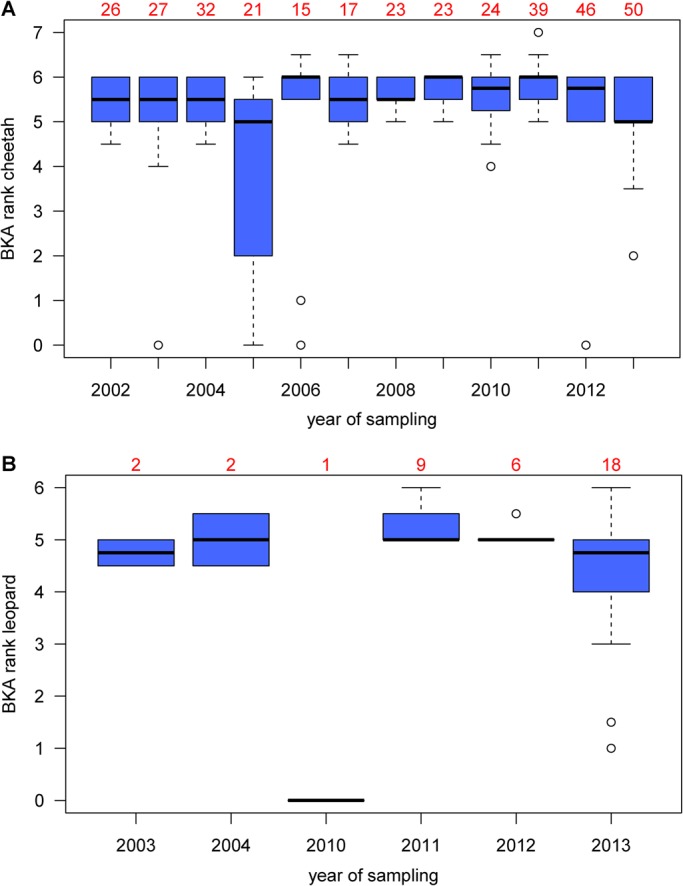
Fig. 1.

BKA ranks of samples from different years. For cheetahs (A) and leopards (B). Numbers above boxplots represent sample sizes. Circles depict values more than 1.5 times the interquartile range below the first quartile. Changes between years were not significant.
