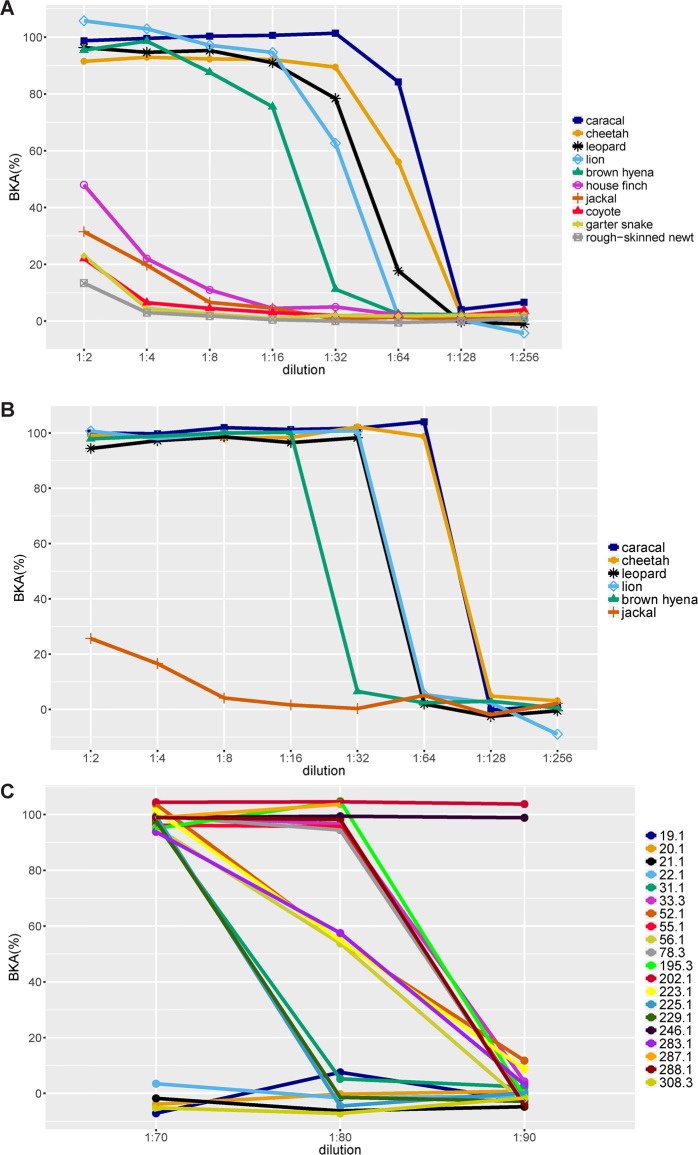
Fig. 4.
BKA values for different species. (A) Mean BKA values for eight serial dilutions of the six carnivore species from this study and four other species (a carnivore, a bird, a reptile and an amphibian) previously published. Values for published species are from Fig. 2A from French and Neuman-Lee (2012). (B) BKA values for eight serial dilutions of six carnivore species. Lines represent one randomly chosen individual per species. (C) BKA values for dilutions 1:70, 1:80 and 1:90 for 20 randomly selected cheetahs.

