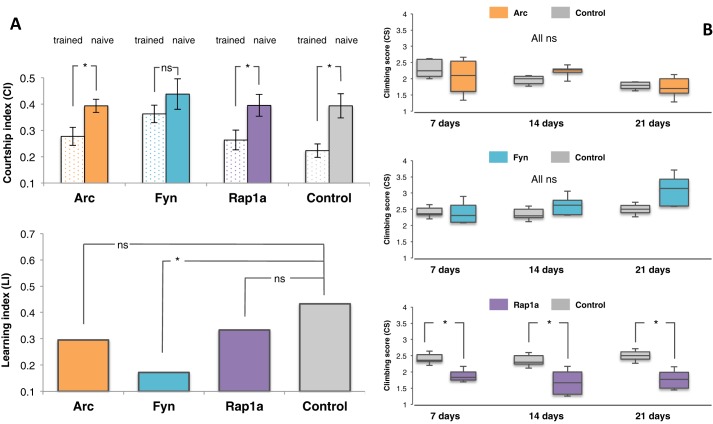
Fig. 1.
Results of the courtship learning and climbing assays, quantifying learning and memory and motor phenotypes, respectively, for selected strains in the collection. (A) Results of the courtship learning assay for the selected genotypes 30y-Gal4; UAS-Arc;+(Arc; Ntrained=14, Nnaive=23), 30y-Gal4; UAS-Fyn;+(Fyn; Ntrained=17, Nnaive=19), 30y-Gal4; UAS-Rap1;+(Rap1a; Ntrained=28, Nnaive=27) and the respective driver and wild type cross 30y-Gal4;+;+ (Control; Ntrained=23, Nnaive=24). All strains exhibit courtship within a relatively normal range (not shown). All lines with the exception of Fyn show significant differences between the Courtship Index (CI) of the trained (empty bar) and naive (filled bar). This translates to the Fyn expressing flies having a significantly lower Learning Index (LI) compared to controls. ANOVA showed that the CI difference between trained and naïve flies for Arc, Rap1a and control were significant (see Table S1 for P-values) while the CI difference between trained and naïve flies for Fyn was not. Multiple testing showed that the LIs Fyn expressing flies were significantly lower than the control (*P=0.0359). Error bars show s.e.m. (B) Results of the climbing assay for the following genotypes: elav-Gal4; UAS-Arc;+(Arc), elav-Gal4; UAS-Fyn;+(Fyn), elav-Gal4; UAS-Rap1;+(Rap1a) and the respective driver and wild type cross elav-Gal4;+;+ (Control). N=50 (5 replicate vials of 10 flies each). For significance testing: ns, P>0.05; *P<0.05. Arc and Fyn show similar climbing abilities to the Control, whereas the Rap1a-expressing line shows a significant difference in the climbing score compared to the control. P-values are 0.0019, 0.0146 and 0.0210 for 7, 14 and 21 days, respectively (see also Table S2). Note how the Arc-expressing line in the figure, like most of the other strains (not shown) has no significant phenotype in the phenotypic assays.

