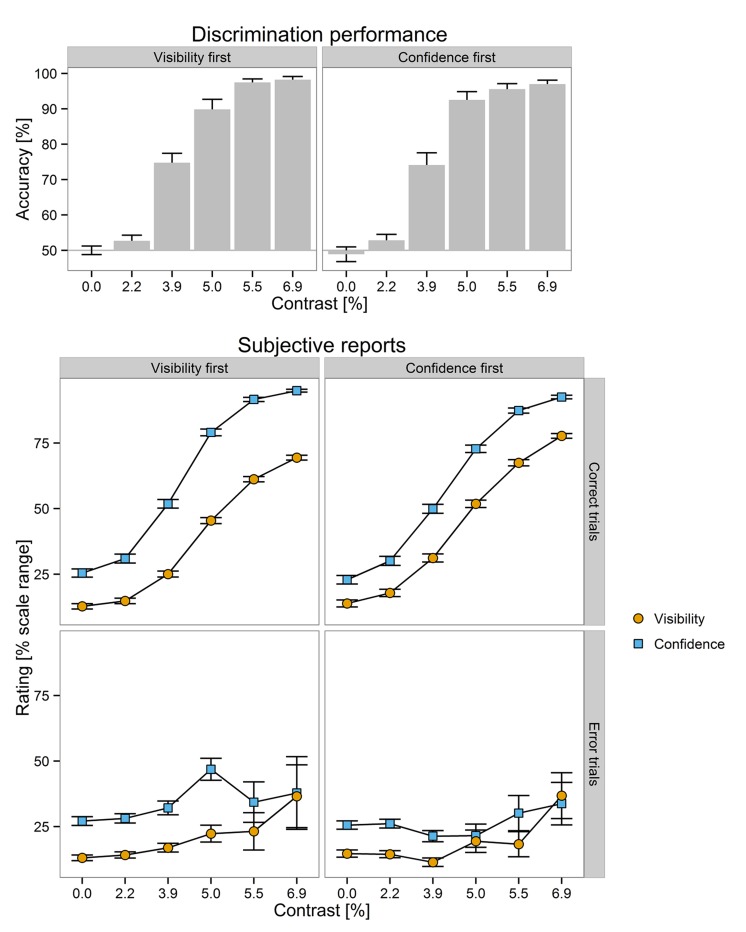
FIGURE 2.
(Upper) Mean discrimination performance as a function of stimulus contrast and scale order (visibility first vs. confidence first, in separate columns). (Lower) Mean subjective reports as a function of trial accuracy (correct vs. incorrect trials, in separate rows), scale order (visibility first vs. confidence first, in separate columns), stimulus contrast (on the x-axis), and scale (visibility vs. confidence, in different colors). Errors bars ⇔ 1 SEM.

