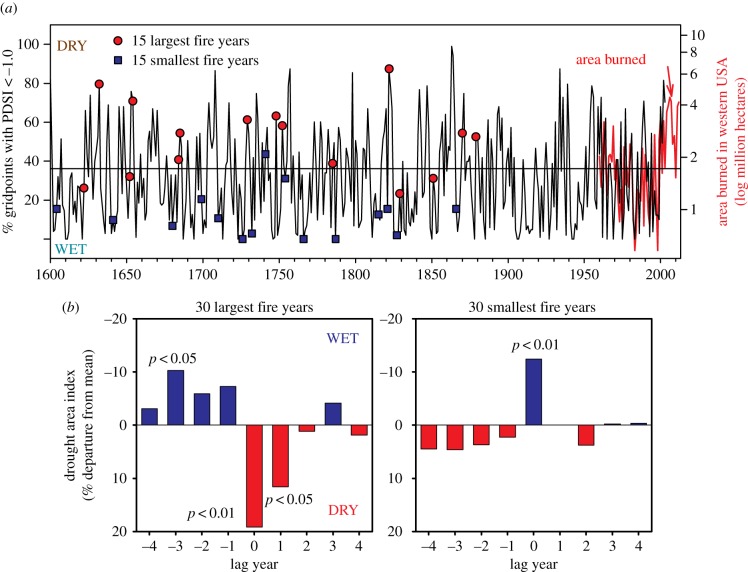
Figure 3.
(a) Drought area index over the western USA is significantly correlated (r = 0.51, p < 0.01) with percentage of sites scarred per year over the region and modern area burned in the USA since 1960 (red line below, r = 0.37, p < 0.01). The 15 largest and smallest fire years are superimposed on the PDSI time series. (b) The SEA shows a strong wet/dry pattern associated with large fire years (left), with only wet years being associated with small fire years (right).

