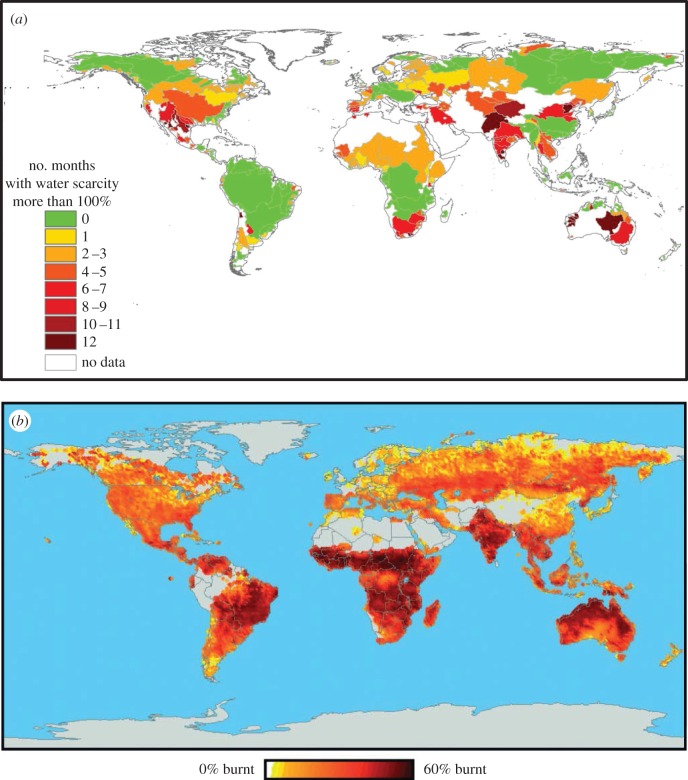
Figure 1.
Comparison of global maps showing (a) water scarcity as indicated by the number of months during the year in which the consumptive use of ground- and surface-water flows exceeds natural river and groundwater flows (minus environmental flows) for the world's major river basins, based on the period 1996–2005 [9], and (b) average annual area burned for the period 1960–2000 [12]. (b) Adapted from [12] with permission from CSIRO Publishing.

