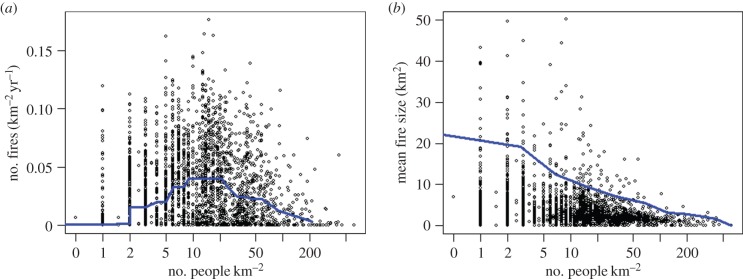
Figure 4.
(a) Relationship between number of people and the number of fires. (b) Relationship between the number of people and the size of fires. Points represent the value per 50 km grid cell. Solid lines represent the median values in (a), and the 95th quantiles in (b). All data are for Africa south of the Equator and were derived by identifying individual fire events using the methods described by Archibald & Roy [28], i.e. they represent individual ignition events, not active fire hotspots.

