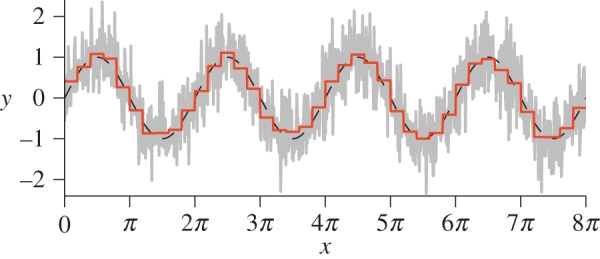
Figure 2.

A demonstration of how PAA can be used to reduce the dimensionality of a time series. A sine wave with additive Gaussian noise (grey) is decomposed into short-time segments, for which the mean value is calculated. The reconstructed representation (red solid line) approximates the ‘true’ signal (black dashed line) well.
