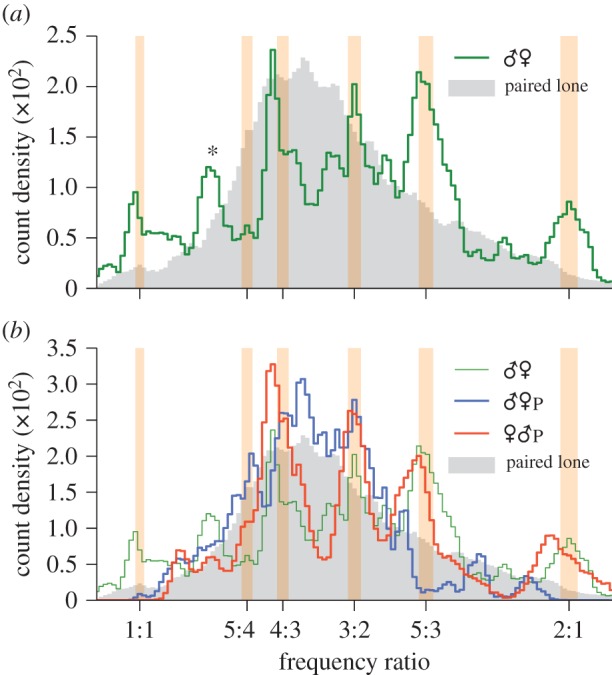
Figure 6.

Distribution of fundamental flight tone ratios between fundamental frequencies for (a) all live paired male–female mosquitoes and (b) individual males (blue) and females (red) subjected to playback sounds of the opposite sex. Common harmonic ratios (±1%) are indicated by shaded vertical bars. In each graph, shaded grey area indicates the distribution of fundamental frequency ratios for random combinations of recordings of opposite-sex solo mosquitoes, i.e. those that are not interacting with one another. The live paired data from (a) are also presented in (b), for comparison.
