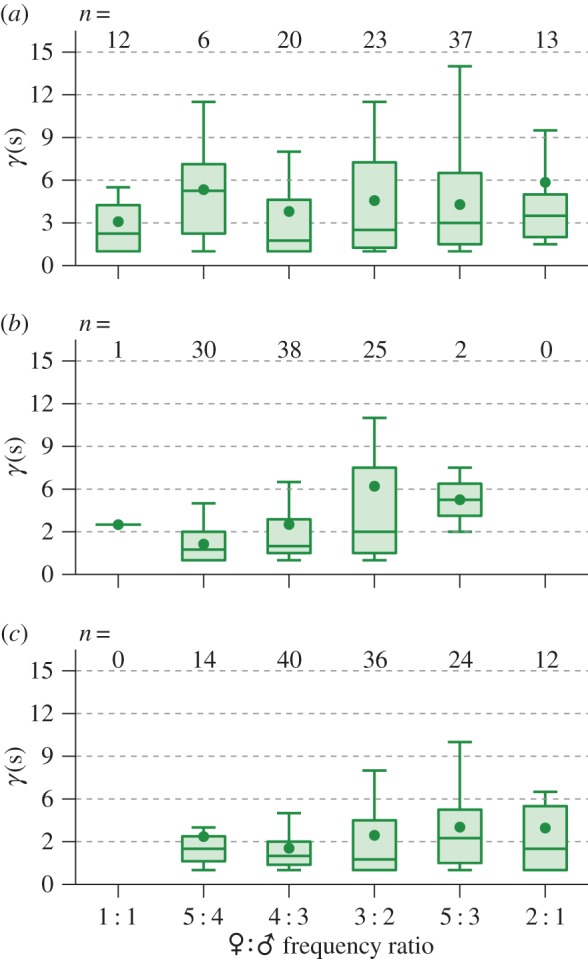
Figure 9.

Boxplots of convergence duration (γ(s)) for unique convergence events at different harmonic combinations in the (a) live opposite-sex pair (♂♀) (b) live male, playback female (♂♀P) and (c) live female, playback male (♀♂P) cohorts. Numbers at the top of each axis indicate the detected frequency of each harmonic configuration within the recordings. As in figure 8a, box lines give (in descending order) the upper quartile, median and lower quartile of the convergence times, and circular markers give the mean.
