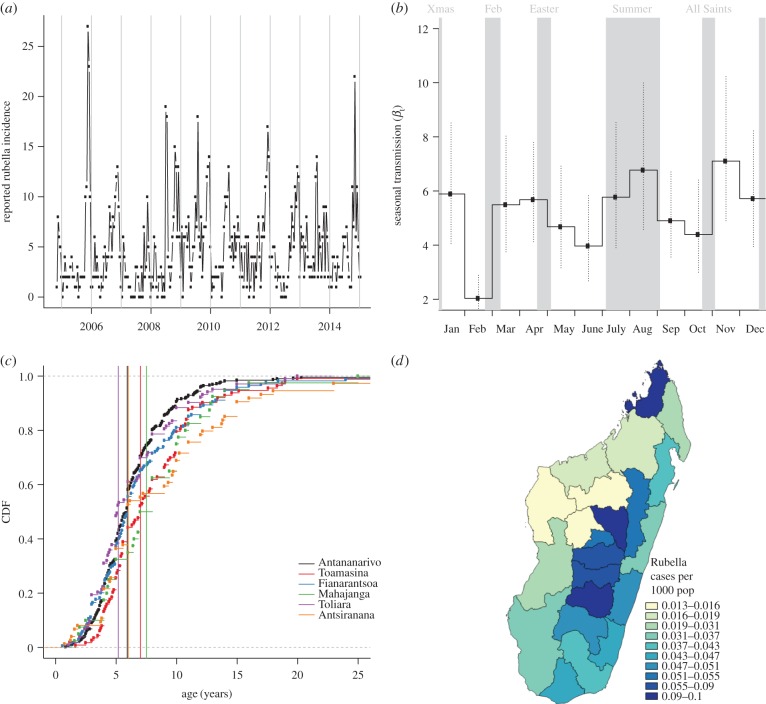
Figure 2.
The epidemiology of rubella in Madagascar. (a) Reported number of cases through time for the entire country; (b) associated estimates of transmission from the TSIR model; (c) age distribution of infection, and average age of infection (vertical lines) associated with each of the six provinces and (d) Map of incidence in regions of Madagascar across the country with colours showing incidence per 1000 inhabitants. (Online version in colour.)

