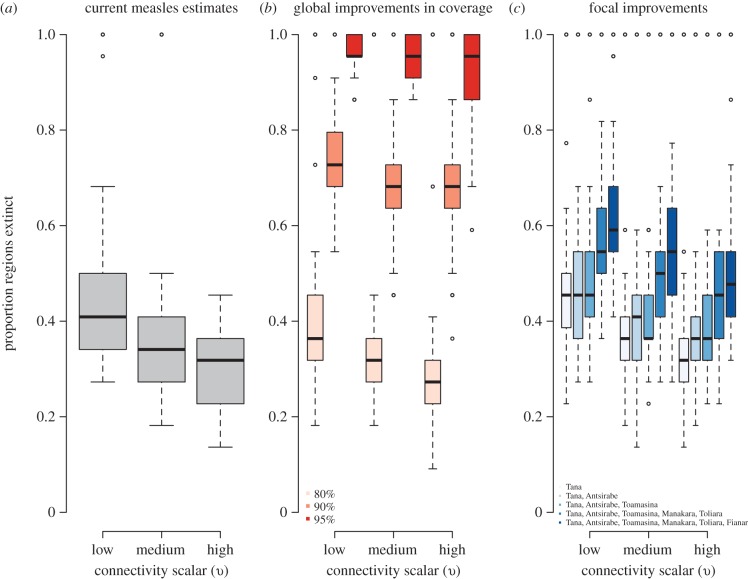
Figure 5.
Consequences of vaccination for extinction of rubella in Madagascar showing the proportion of the 22 regions in which rubella is extinct after 20 years of vaccination across 100 simulations for three levels of the connectivity scalar υ. This range of values of υ were set such that the associated rescaling for the connectivity matrix estimated from geospatial data resulted in dynamics of rubella in Madagascar that captured the globally reported range of the CCS for rubella (see the electronic supplementary material, figure S4) across 100 simulations. Results are shown (a) at current reported administrative levels of coverage; (b) for 80, 90 and 95% coverage in all regions and (c) at reported levels of coverage but with an increase to 95% in focal regions (organized in sequence to explore cumulative effects) whose administrative capitals are indicated in the figure legend. Proportion of simulations in which extinction is achieved is reported in the main text. (Online version in colour.)

