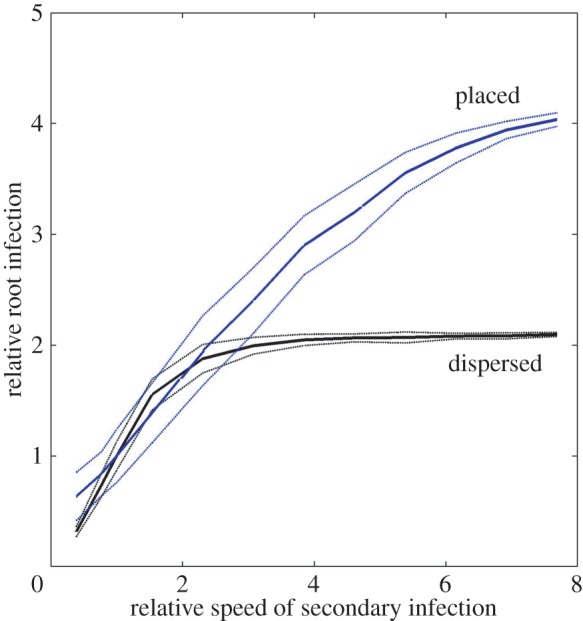
Figure 4.

Change in relative % of root length infected owing to varying the speed of secondary infection compared with the standard value (vi = 0.13). Two cases of inoculum are considered, concentrated (results shown in blue) and dispersed (results shown in black). Solid and dotted lines represent mean and standard deviation of 100 realizations of a 21-day-old root system.
