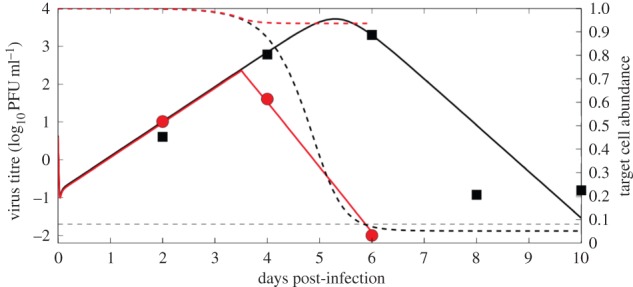
Figure 5.

The numerical solutions of the models (virus titre) together with data from the wild-type and knockout study [12]. The solid black line is the numerical solution of the virus titre from the target cell-limited model (equations (2.1)–(2.4)) using one representative parameter set from our estimation algorithm and the black squares are the data from knockout mice. The black dashed line is the predicted corresponding target cell dynamics (fraction of target cells remaining). The red solid line is the numerical solution of the virus titre from the model including a humoral response (equations (2.6)–(2.9)) and the red circles are the data for wild-type mice. The red dashed line is the corresponding predicted target cell dynamics. The limit of detection (LOD) of the assay is indicated by the horizontal dashed line. The day 6 data point for wild-type mice was below the LOD and set to half the LOD [53]. The parameters used to generate the plot are: T0 = 2.3 × 10⁵ ml−1, V0 = 4.3487 PFU ml−1, β = 4 × 10⁻⁴ ml day−1, δ = 23.0341 day−1, p = 57.88 PFU day−1, γ = 44.43 day−1, V0 for WT = 4 PFU ml−1,  , ti = 3.5 days.
