Figure 1.
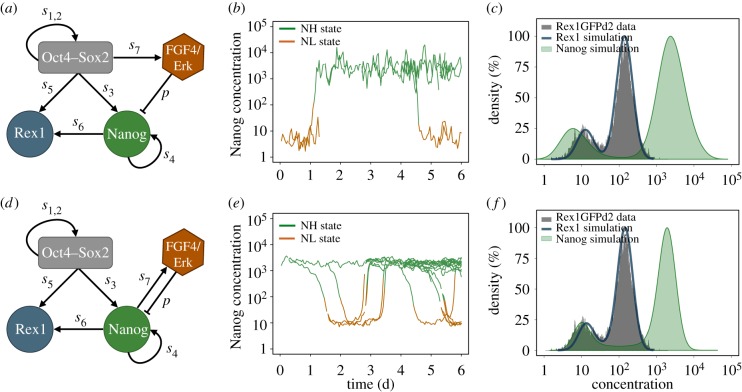
Comparison of the agent-based fluctuation and oscillation model. (a) Network scheme of the fluctuation model. The negative regulation of Nanog by Fgf4/Erk captures mESCs in a bistable setting. The repression rate is termed p; transcription rates are denoted by si. (b) Stochastic fluctuations between the NH and the NL state of one simulated cell and its progeny. (c) Bimodal Nanog and Rex1 distributions of a simulated cell population adapted to flow cytometry data of Rex1GFPd2 mESCs (grey histogram). (d) Network scheme of the oscillation model. The negative feedback loop between Nanog and Fgf4/Erk generates sustained oscillations. (e) Oscillations between NH and NL levels of one simulated cell and its progeny. (f) Bimodal Nanog and Rex1 distributions of a simulated cell population adapted to flow cytometry data of Rex1GFPd2 mESCs (grey histogram). (Online version in colour.)

