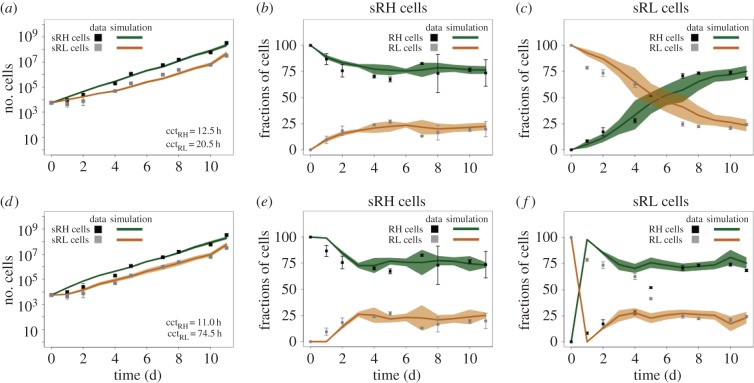
Figure 2.
Experimental and model results on the expansion and on expression profiles of sorted Rex1GFPd2 mESCs. (a,d) Cell counts of living cells in initially sorted RH (sRH, black squares) and sorted RL (sRL, grey squares) populations together with simulation results (lines) for the best-fit parameters using the fluctuation model (a) and the oscillation model (d). (b,e) Percentages of measured RH (black squares) and RL (grey squares) cells in sRH populations together with simulation results of the fluctuation model (b) and the oscillation model (e). (c,f) Percentages of measured RH (black squares) and RL (grey squares) cells in sRL populations and simulation results of the fluctuation model (c) and the oscillation model (f). The mean cell counts and percentages of cultured mESCs are depicted as squares ± standard deviation (whisker). The mean number and proportions of the simulated replicates are depicted as lines ± standard deviation (bands). (Online version in colour.)

