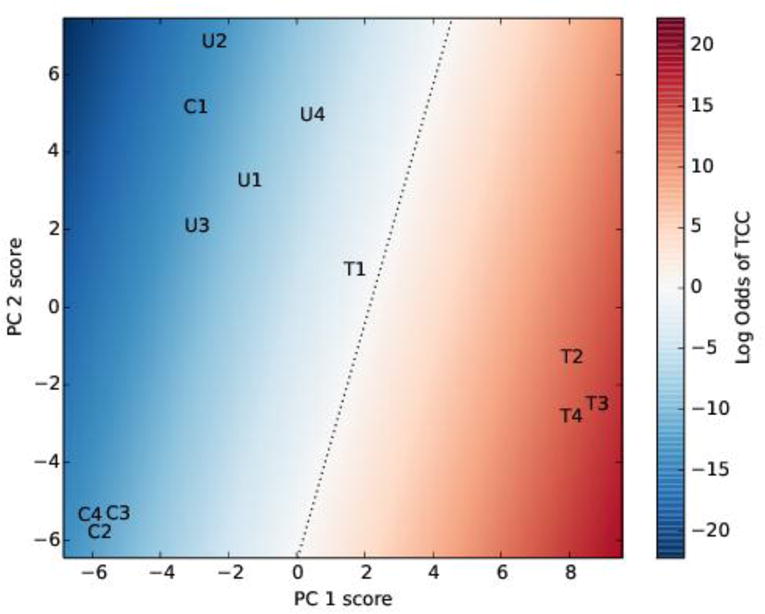
Figure 4.

Principal component analysis and linear discriminant analysis of the initial data. The data were transformed using principal component analysis, keeping two components, followed by linear discriminant analysis. The letters C, U and T represent the control, UTI and TCC samples, respectively. The background color indicates the model odds of TCC; the dotted black line is where the odds of TCC is 1 (i.e. the log odds of TCC is 0). PC is principal component.
