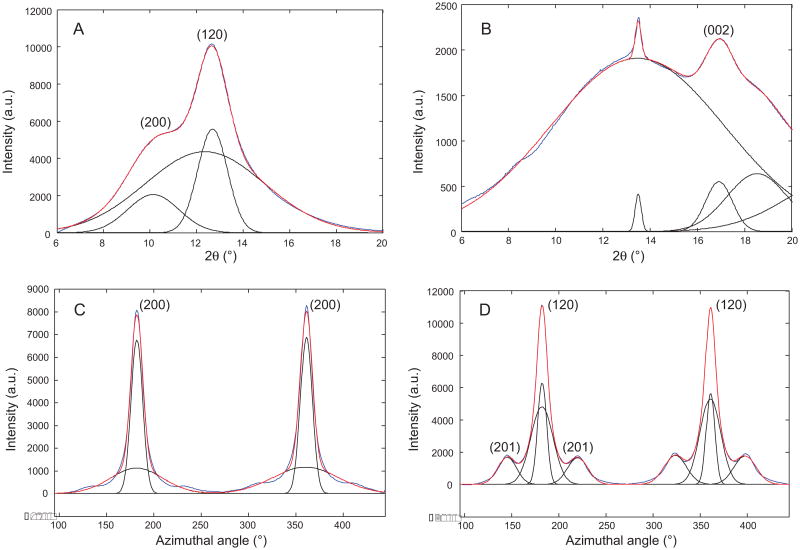
Fig. 3.
1D WAXD radial intensity profiles for Green Lynx major ampullate silk fibers. The (120/200) equatorial peaks (A) and the (002) meridian peak (B) are deconvoluted into broad amorphous and narrow crystalline components (black line). The (200) and (120) peak (C and D) are also radially deconvoluted (black line). Blue line is the experimental data while the red line is the total fit.

