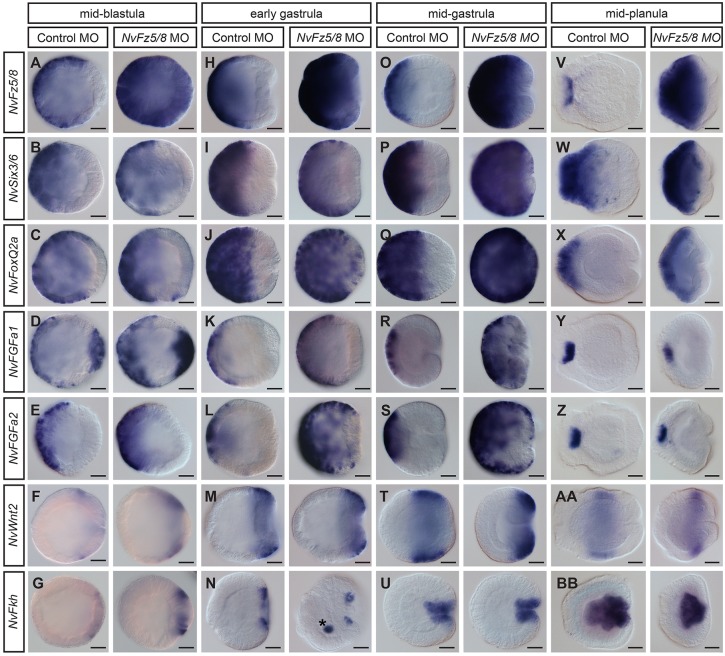
Fig. 6.
NvFz5/8 limits the size of the aboral domain during gastrulation. (A-BB) Lateral views (aboral pole to the left) of in situ hybridizations at the stages indicated above. Injections are also indicated above, probes on the left. The expansion of aboral marker gene expression and the reduction of oral markers are first visible at early gastrula stage and become more pronounced at mid-gastrula stage; see main text for more details. Asterisk in N indicates non-specific staining. Scale bars: 50 µm.

