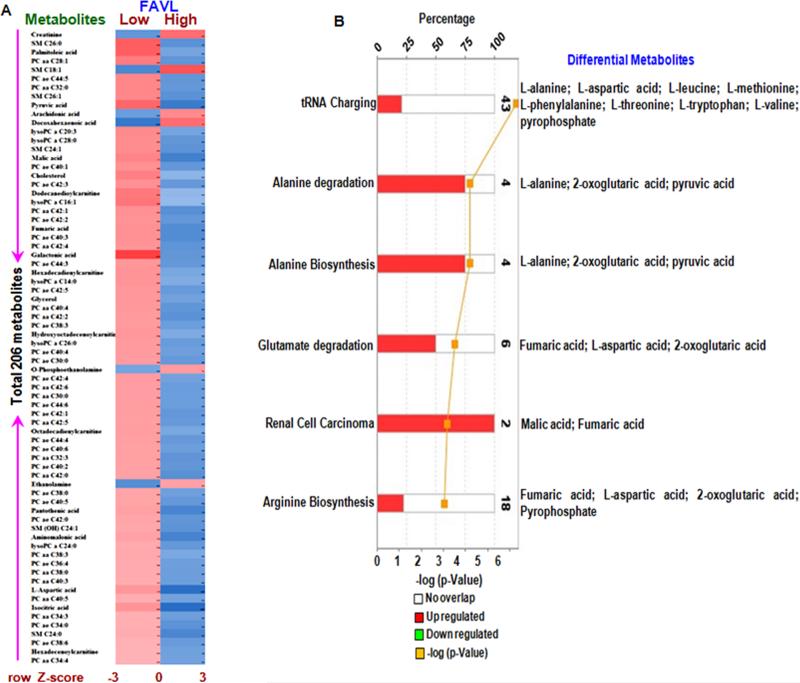
Figure 3. Metabolic profiles for BC cells carrying an impaired FA pathway compared to cells carrying an intact FA pathway.
A. The heatmap for the intensity variations of the total 206 metabolites identified with GC-TOFMS and UPLC-MS/MS together. B. Most significantly altered canonical pathways and its metabolites revealed by IPA analysis.

