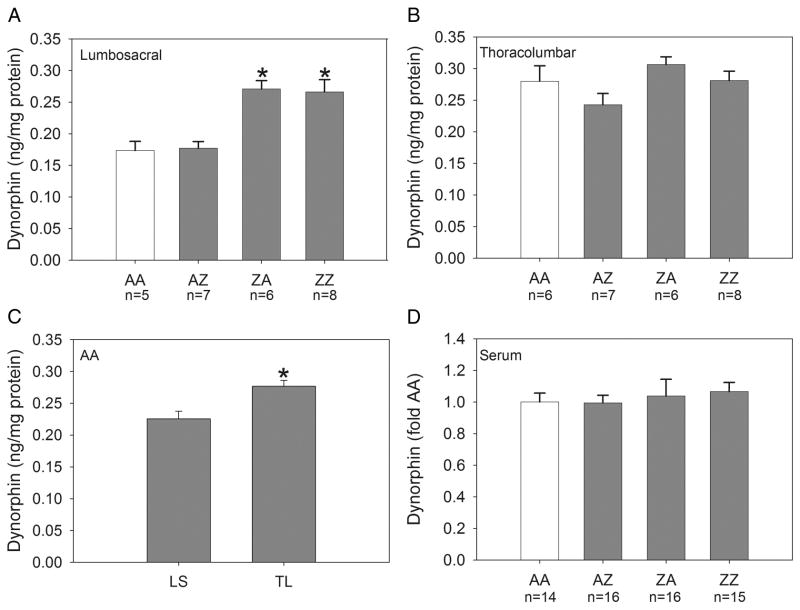
Figure 1.
Group mean content of dynorphin in the lumbosacral and thoracolumbar spinal cord and serum. Panel A: Dynorphin content was significantly increased in the lumbosacral spinal cord of groups ZA and ZZ compared to groups AA and AZ (*p≤0.001; n=5-8/group). Panel B: Dynorphin content in the thoracolumbar spinal cord was not significantly altered by the treatments (n=6-8/group). Panel C: Dynorphin content in the thoracolumbar spinal cord of AA controls was significantly greater than in the lumbosacral spinal cord (p=0.006). Panel D: Dynorphin content in serum was not altered by the treatments (n=14-16/group). AA control data are shown in open bars.

