
Fig. 2.
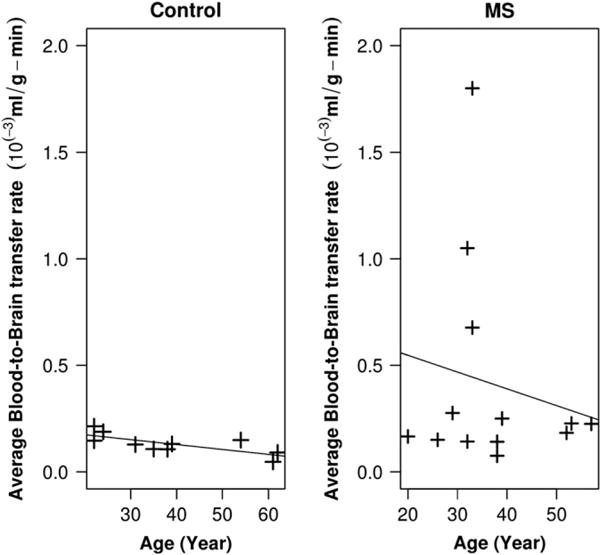
Averaged full-brain BBB transfer rate in MS and controls (calculated for the supraventricular area of brain). Left panel shows the distribution of average BBB transfer rate for the age of controls. There was a significant correlation between the age and BBB transfer rate in controls (p-value < 0.001, R2 = 0.5462). In the right panel, the distribution of full-brain BBB transfer rate in patients with MS is shown where no significant correlation between age and BBB transfer rate were observed (R2 = 0.030). Mean of BBB transfer rate for controls was 1.3 × 10⁻⁴ ml/g-min while the mean of BBB transfer rates of MS patients was 4.1 × 10⁻⁴. We found a statistically significant difference between these two means, with a p-value < 0.05.