
Fig. 4.
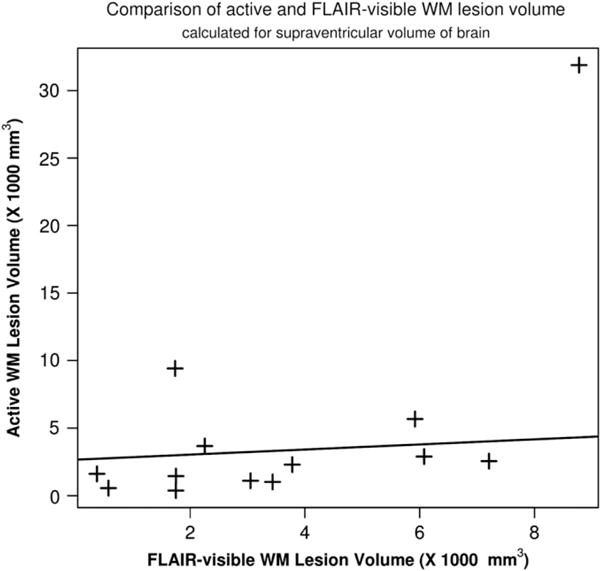
Relationship between FLAIR-visible lesion volume and active lesion volume calculated from BBB transfer rate maps. These two calculated abnormal volumes were compared for possible correlations. A linear function is fitted to the data, a weak correlation was found between these two lesion volumes (p-value < 0.001, R2 = 0.37).