
Fig. 5.
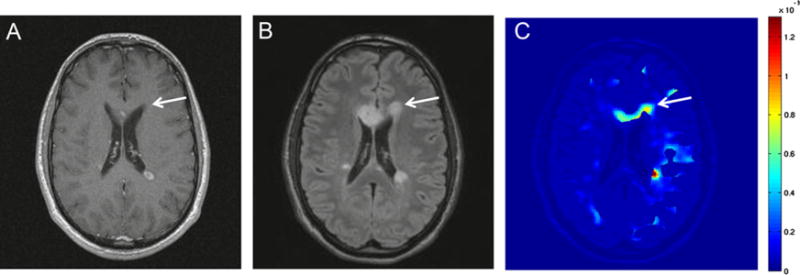
Comparison between the quantitative BBB transfer rate map acquired by DCEMRI and qualitative Gad-enhanced images for detection of WM abnormalities in MS. Image A is a Gad-enhanced T1 image acquired with a bolus injection of full dose of Gd-DTPA. Image B is a T2 FLAIR image, and image C is a parametric image, mapping the BBB transfer rate. In these images, arrows indicate the corresponding area of a FLAIR-visible lesion. The area is not highlighted in Gad-enhanced image. However, this area is color-coded as one with elevated BBB transfer rate. (For interpretation of the references to color in this figure legend, the reader is referred to the web version of this article.)