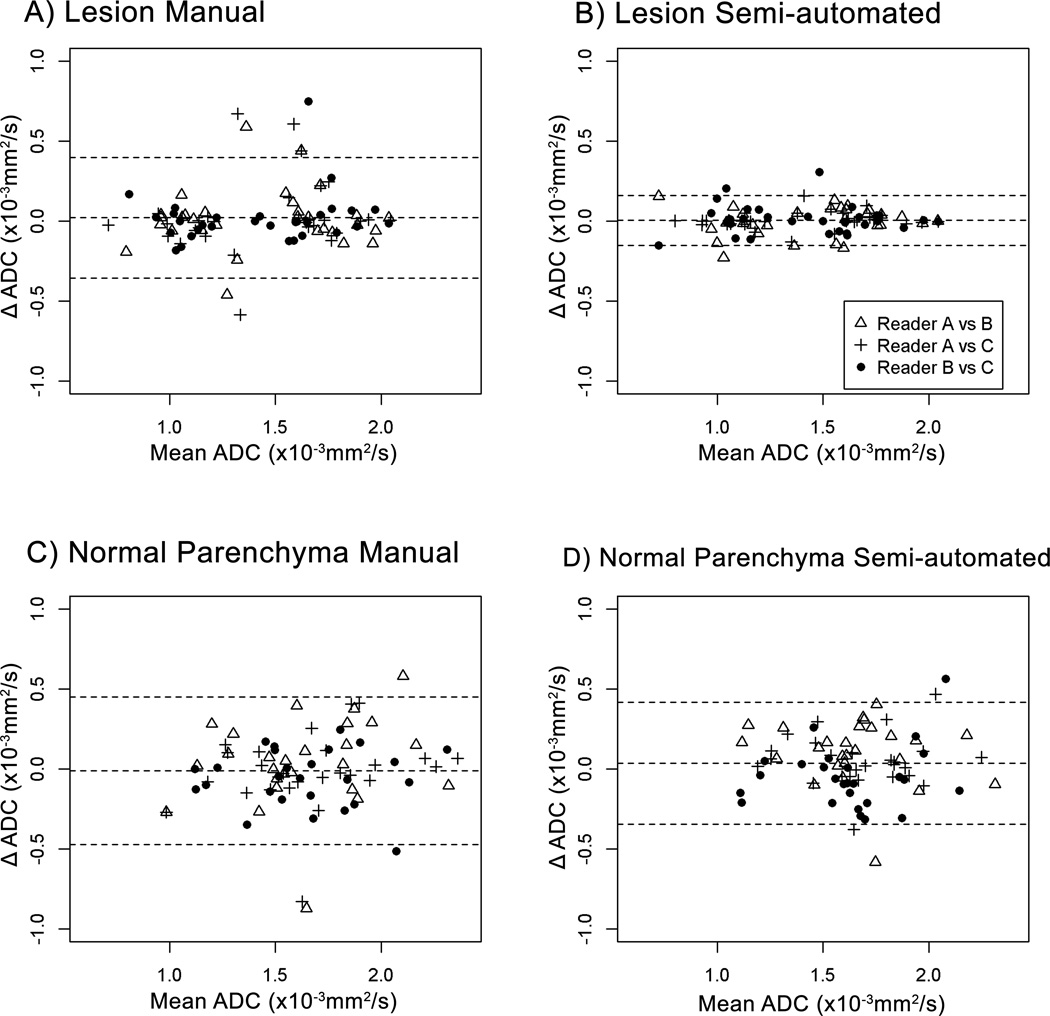
Figure 6.
Bland-Altman plots showing comparisons of ADC measures (×10−3 mm2/s) among 3 readers for lesions using the manual (A) and semi-automated (B) techniques as well as for normal tissue using the manual (C) and semi-automated (D) techniques. In all panels the middle horizontal line (the average difference of readers’ paired ADC measures) is close to zero. The limits of agreement for lesions were narrower for the semi-automated method (B) when compared to the manual method (A), indicating the semi-automated method had greater inter-reader reproducibility.

