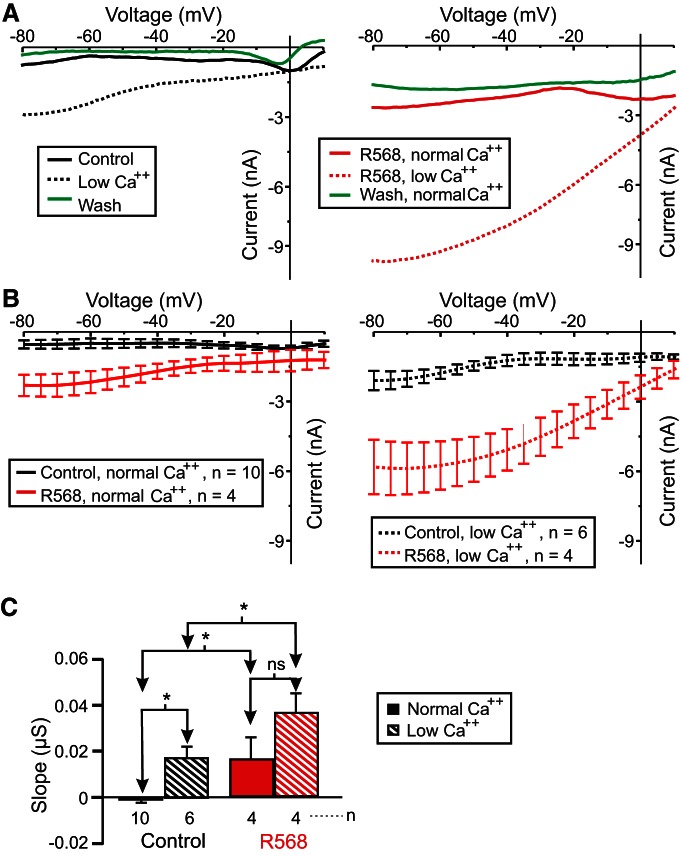
Figure 9.
The CaSR agonist R568 increases proctolin-induced IMI slope in LP neurons. Proctolin-induced IMI was measured in the presence (red) or absence (black) of 10 µm CaSR agonist R568 in either 13 mm CaCl2 (solid) or 2 mm CaCl2 (striped). A, Left, Representative I–V curves of proctolin-induced IMI in 13 mm CaCl2 (black solid), 2 mm CaCl2 (black dotted), and 13 mm CaCl2 (green solid) after a 1 h wash. Right, Representative I–V curves of proctolin-induced IMI in the presence of 10 µm CaSR agonist R568 in normal (13 mm) calcium (red solid), low (2 mm) calcium (red dotted), and then in normal calcium after 1 h wash from R568 (green solid). B, Left, Averaged I–V traces of all proctolin-induced IMI experiments in normal calcium in the presence (red solid) or absence (black solid) of 10 µm R568. Right, Averaged I–V traces of all proctolin-induced IMI experiments in a low-calcium condition in the presence (red dotted) or absence (black dotted) of 10 µm R568. C, Quantification of IMI slope. Two-way ANOVA for factors R568 and calcium showing significant changes in proctolin-induced IMI slope (calcium: F(1,20) = 8.560, p = 0.008; R568: F(1,20) = 9.295, p = 0.006; interaction: F(1,20) = 0.0324, p = 0.859ag). Error bars indicate the SEM. Tukey’s test: *p < 0.05; ***p < 0.001.

