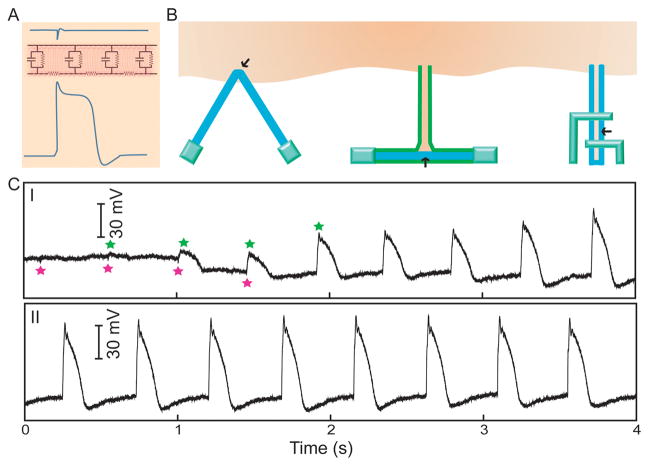
Figure 4. Intracellular electrical recording with field effect transistors.
(A) Plot comparing the amplitude of intracellular (lower) vs extracellular (upper) FET recordings, with shape ‘distortions’ due to the resistor-capacitor (RC) components from plasma membrane (middle). (B) Several FET configurations for intracellular recording. The black arrows indicate the sensing domains. (C) Electrical recording traces from a kinked nanowire probe as it transitions (I) from an extracellular (magenta stars) to intracellular (green stars) space, and (II) reaches an intracellular steady state.

