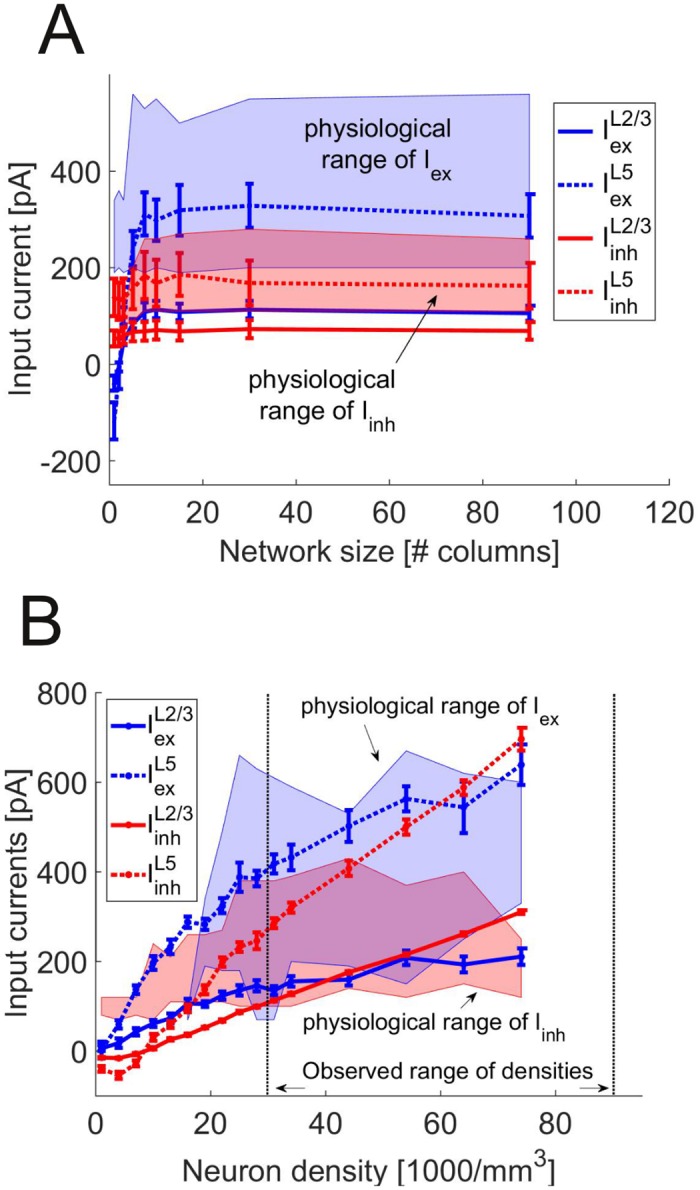
Fig 7. Scaling of total synaptic input current with network size.

(A) Synaptic input current as a function of the number of columns. Shown are the averaged values over different neuron densities (mean ± SEM) as a function of column number for the inputs into L2/3 pyramidal cells (solid blue), L2/3 interneurons (solid red), L5 pyramidal cells (dotted blue) and L5 interneurons (dotted red). The region of currents which yield in vivo-like behavior (cf. black region in Fig 6A, DKS < 0.4) is marked in blue for Iex and in red for Iinh. (B) Same as in A, but synaptic input as a function of total cell density, averaged over column numbers ≥ 5. The dotted horizontal lines show the upper and lower bound of densities found in anatomical studies.
