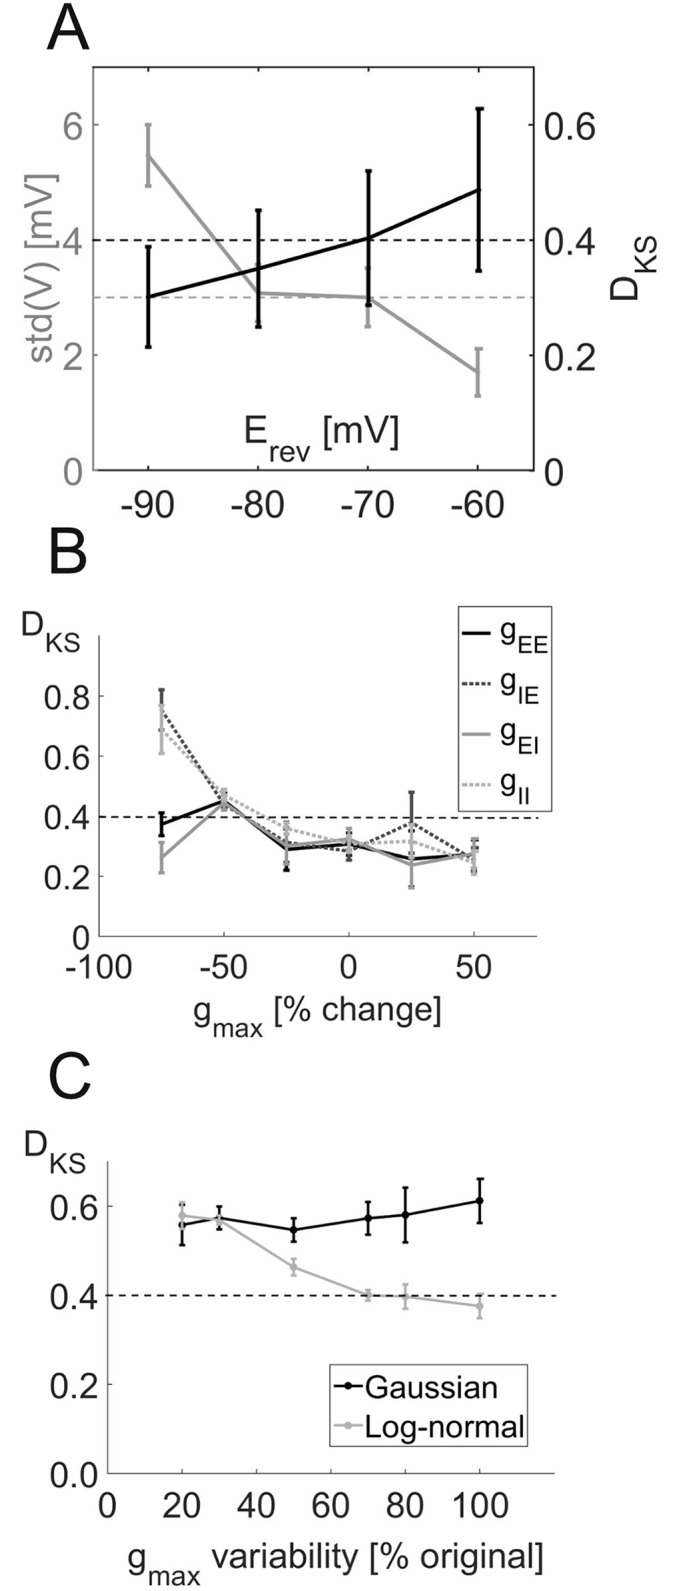
Fig 8. Effect of synaptic parameter changes on network activity.

(A) Maximum of the Kolmorov-Smirnov test statistics (DKS) comparing the three experimental and simulated distributions (black) and standard deviation of the simulated membrane potential (gray) for different GABAA reversal potentials. Each data point is the mean ± SEM over several values of input currents. The black line denotes the DKS limit of 0.4 above which differences become significant (p ≤ 0.05), and the gray line marks the average of the experimentally observed standard deviations (cf. Fig 4A). (B) DKS values as a function of percent change in overall synaptic peak conductances between pyramidal cells (E) and interneurons (I). The dotted line denotes the critical DKS value of 0.4 (see above). (C) DKS values for different values of the standard deviation of the synaptic peak conductances using either the original log-normal distribution (gray curve) or a Gaussian distribution with the same mean and standard deviation (black curve). As above, the dotted line marks the critical DKS value of 0.4. In all figures, each data point shows the mean ± SEM over the DKS values for a number of different input currents.
