
Fig. 3.
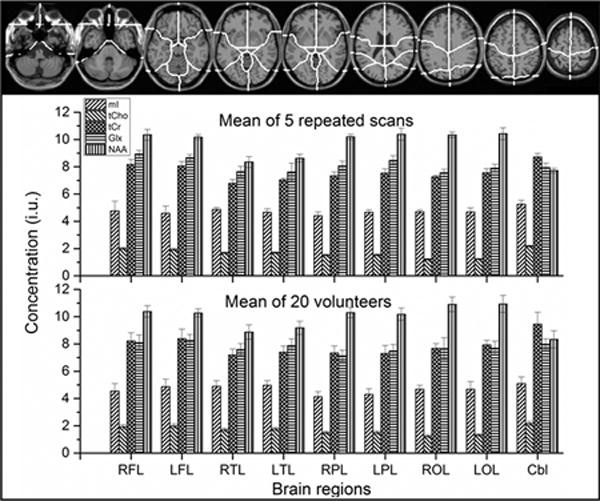
Mean regional metabolite concentrations of the 5 repeated scans (Fig.3 middle) and the 20 volunteers (Fig.3 bottom) obtained with multi-voxel analysis and linewidth threshold of 11 Hz, based on atlas-defined lobar anatomic regions which identified nine anatomical regions (Fig.3 top) defining the left and right cerebral lobes and the cerebellum (25). Note: the first letter R = right; the second letter F = frontal, P = parietal, O = occipital, T = temporal; the third letter L = lobe; Cbl = cerebellum.