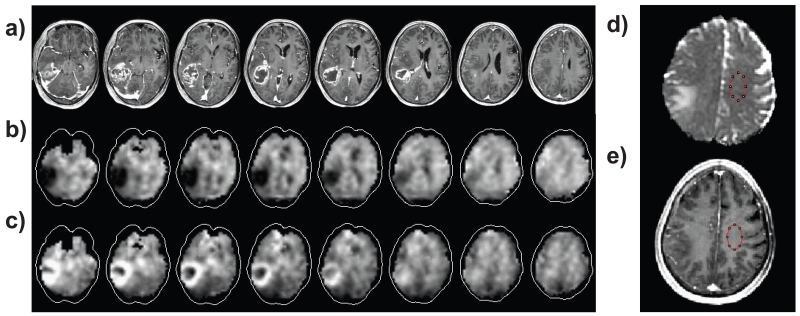
Figure 1.
Example images showing selected slices from the multi-planar MRSI and typical ROI selection used for the MD measurement, with a) post-contrast T1-weighted MRI at slices corresponding to the center of the MRSI slices; b) NAA map; c) Cho map; d) MD map with ROI selection; and e) T1 MRI with the corresponding ROI.

