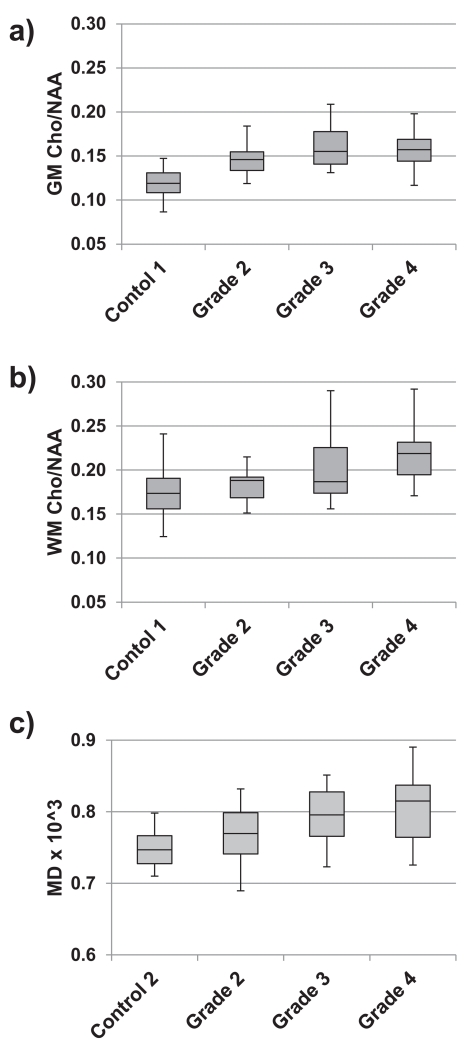
Figure 2.
Example distributions of imaging measures for all subjects within each of the subject groups. Box-and-whisker plots are shown for a) grey-matter Cho/NAA, b) white-matter Cho/NAA, and c) MD. The plots show the minimum, the first quartile, the median, the third quartile, and the maximum value within the group.

