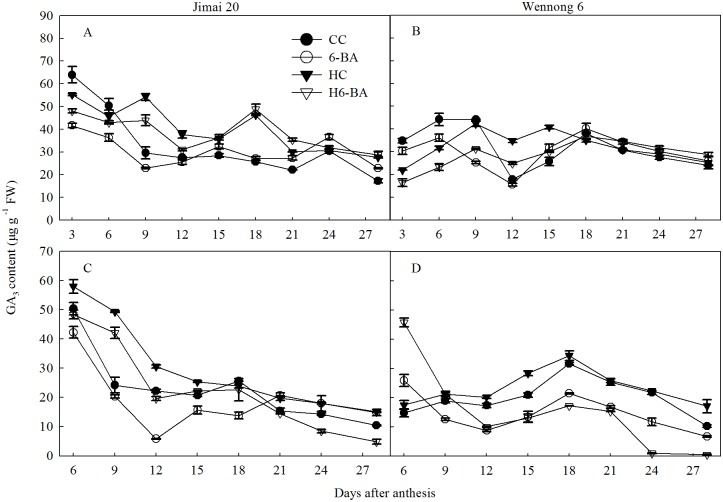
Fig 7. GA3 content in superior (A, B) and inferior kernels (C, D).
CC and 6-BA represent treatment with water and 6-BA under non-heated condition, respectively. HC and H6-BA represent treatment with water and 6-BA under heated condition, respectively. Vertical bars represent ± standard error of the mean (n = 3) where they exceed the size of the symbol.

