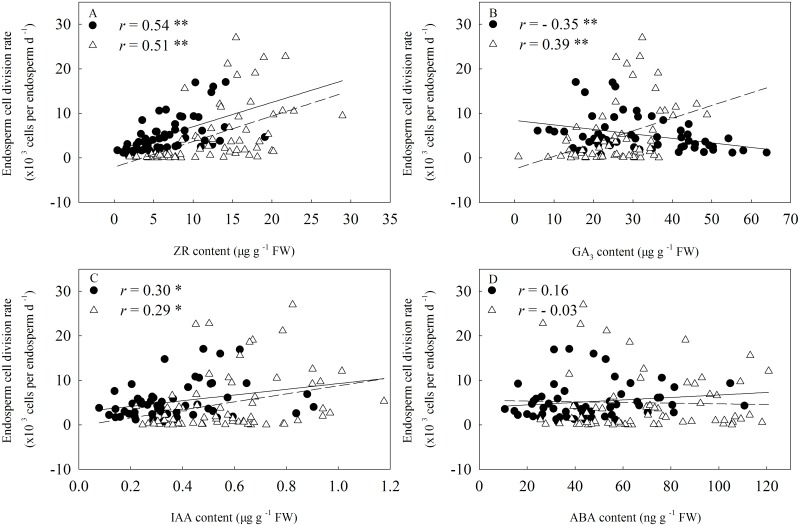
Fig 11. Relationship between endosperm cell division rate and hormone concentrations in the kernels.
Closed circles and open triangles represent hormone concentration at 3 to 12 days after anthesis (DAA) and at 15 to 24 DAA, respectively. The solid and short dotted line represent the regression line between endosperm cell division rate and hormone concentration at 3 to 15 DAA (n = 56) and at 18 to 28 DAA (n = 64), respectively. Correlation coefficients (r) are calculated and asterisks (**) represent significance at the 0.01 probability level and asterisks (*) represent significance at the 0.05 probability level.

