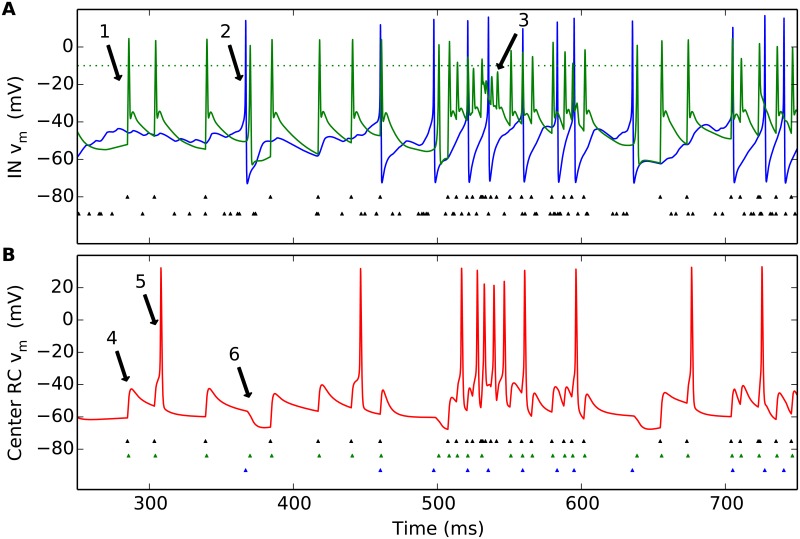
Fig 6. Illustration of temporal response in dLGN model circuit.
A stimulus spot of diameter d = 1 deg is turned on at 500 ms. (A) Example of (single-trial) IN membrane-potential dynamics (soma: blue line; distal part of dendritic segment receiving synaptic input from central GC cell: green line). Also shown are GC input spikes driving the circuit, both from the center GC cell (top row of tiny triangles) and from the four peripheral GC cells (bottom row of triangles). (B) Corresponding RC membrane-potential dynamics. Also shown are input spikes from the central GC input (top row of tiny black triangles), IN dendritic (triadic) action potentials (middle row of green triangles), and IN somatic action potentials (bottom row of blue triangles). See text for explanation of arrows. Default model parameters are used, cf. Tables 2–4.

