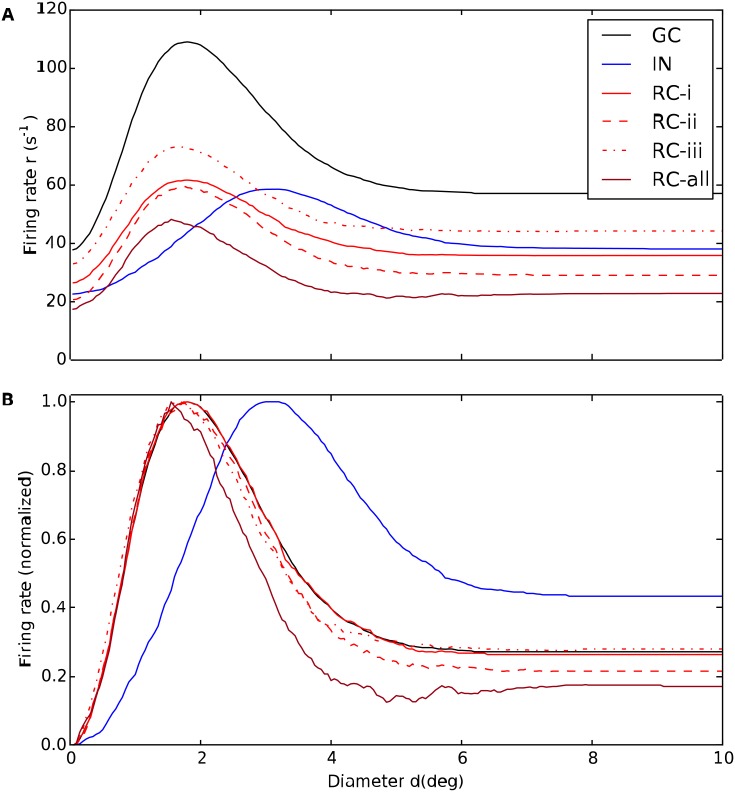
Fig 8. Example area-summation curves illustrating effects of various types of inhibition on relay-cell (RC) response.
(A) Trial-averaged spike-count firing rate vs. spot diameter, for central retinal ganglion cell (GC, solid black), interneuron (IN, solid blue), and relay cell (RC, red lines). Red solid line: RC response for direct triadic inhibition (RC-i) with wIRt = 4 nS, wGIp = 0, wIRa = 0. Red dashed line: RC response for direct & soma-driven triadic inhibition (RC-ii) with wIRt = 4 nS, wGIp = 0.6 nS, wIRa = 0. Red dotted line: RC response for axonal inhibition (RC-iii) with wIRt = 0, wGIp = 0.6 nS, wIRa = 4 nS. Dark red line (RC-all) corresponds to results from all three types of inhibition combined, i.e., wIRt = 4 nS, wGIp = 0.6 nS, wIRa = 4 nS. wGR = 15.6 nS is used in all cases. Other parameters correspond to default values. Note that the depicted IN response does not apply to case (RC-i) as the IN is only synaptically activated at the triads in this case as wGIp = 0. (B) Area-response curves in A normalised to have maximal values of unity. The receptive-field center diameters dc corresponds to the spot diameter giving the largest response. The spike-count firing rates are found by averaging PSTHs of the type in Fig 7 over the entire 500-ms time window the stimulus is on.

