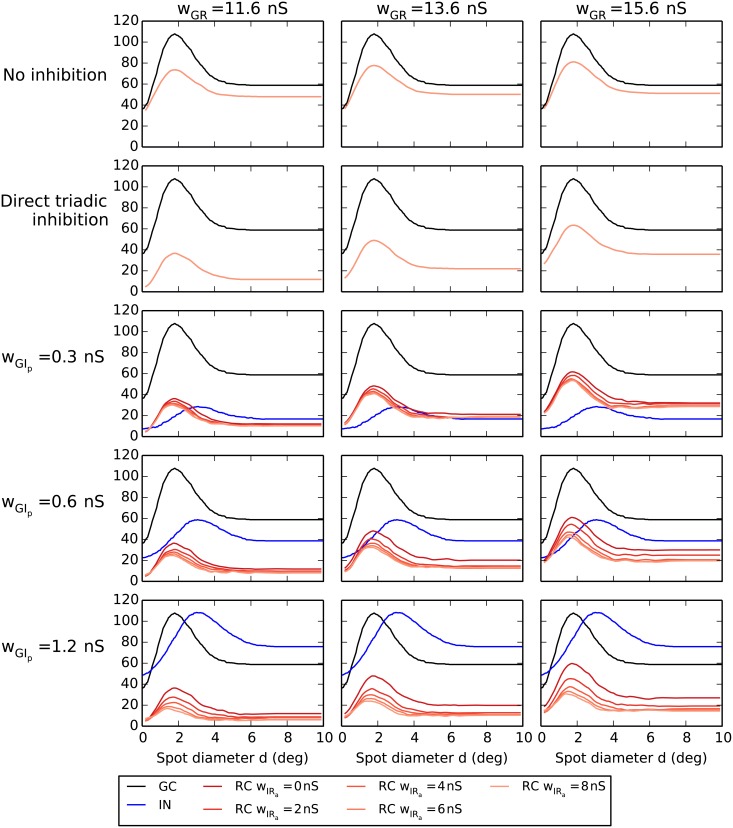
Fig 9. Area-response curves with triadic inhibition.
Row 1: no inhibition. Row 2: direct triadic inhibition only (case (RC-i)). Rows 3–5: triadic or triadic+axonal inhibition for different values of weight proximal ganglion-cell input to the interneuron wGIp. Black curves correspond to central retinal ganglion cell (GC), blue curves to interneuron (IN), and red/orange curves to relay cell (RC). The four RC curves in the panels in rows 3–5 correspond to wIRa = 0/2/4/8 nS with wIRa = 0 (no axonal inhibition) and wIRa = 8 nS (maximal axonal inhibition) corresponding to the top and bottom of the four curves, respectively.

