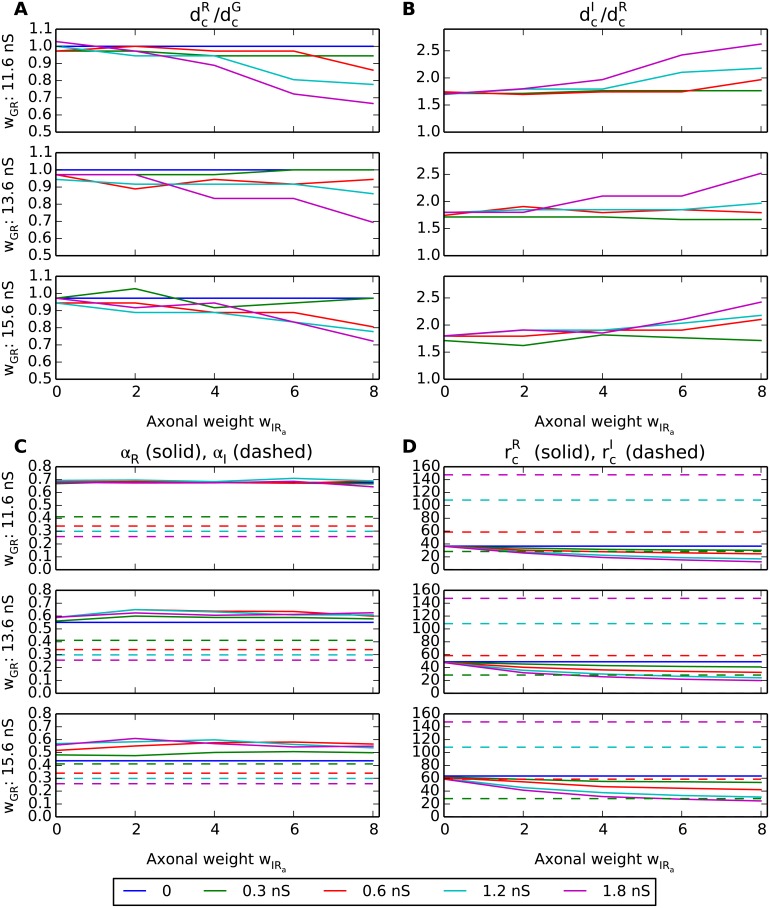
Fig 10. Summary of response measures from area-response curves with triadic inhibition present.
(A) Ratio of receptive-field center diameter of relay cell (RC) and (central) retinal ganglion cell (GC), ; receptive-field center diameter measured as the spot diameter corresponding to the largest firing rate in the area-summation curves in Fig 9. (B) Ratio of receptive-field center diameter of interneuron (IN) and relay cell (RC), . (C) Relay-cell αR (solid) and interneuron αI (dashed) center-surround antagonisms, cf. Eq 7. (D) Maximal firing rate rc, i.e., firing rate for spot exactly covering receptive-field center, for relay cell (, solid) and interneuron (, dashed). The colored lines correspond to different values of wGIp, see legend below panels. Note also that interneuron (IN) results are absent for the case with wGIp = 0 (blue lines) since in this case the IN only receives triadic input and does not fire any action potentials.

