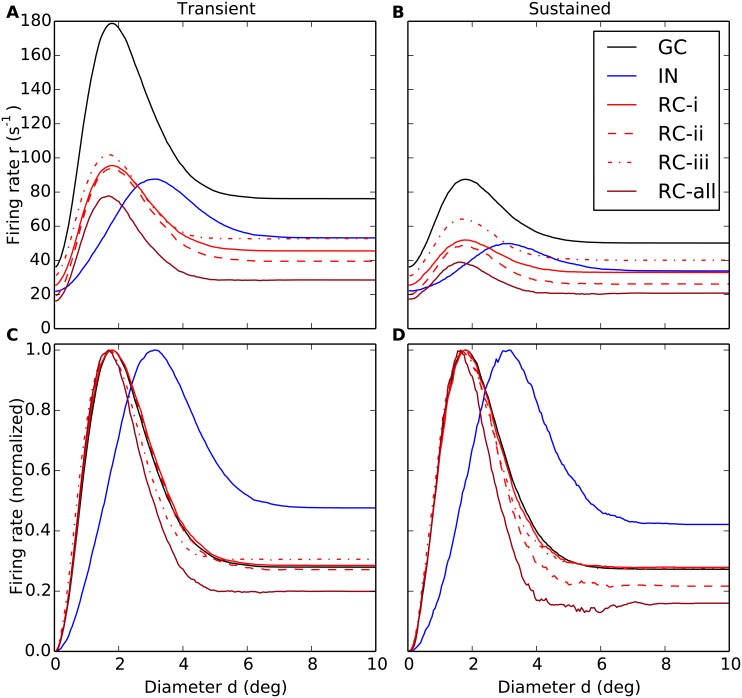
Fig 13. Area-summation curves for transient response and sustained response for relay-cells (RCs).
(A–B) Trial-averaged spike-count firing rate vs. spot diameter, for central retinal ganglion cell (GC, solid black), interneuron (IN, solid blue), and relay cell (RC, red lines) for transient (A) and sustained responses (B). (C–D) Area-summation curves in A and B normalized to the maximum firing rate for each cell. The transient response corresponds to the trial-averaged spike-count firing rate for the first 100 ms after stimulus onset, while the sustained response corresponds to the averaged rate in the time interval from 400 to 500 ms after stimulus onset, cf. Fig 7. The depicted models examples are the same as in Fig 8: Red solid line: RC response for direct triadic inhibition (case (RC-i)) with wIRt = 4 nS, wGIp = 0, wIRa = 0. Red dashed line: RC response for direct & soma-driven triadic inhibition (case (RC-ii)) with wIRt = 4 nS, wGIp = 0.6 nS, wIRa = 0. Red dotted line: RC response for axonal inhibition (case (RC-iii)) with wIRt = 0, wGIp = 0.6 nS, wIRa = 4 nS. Dark red line (RC-all) corresponds to results from all three types of inhibition combined, i.e., wIRt = 4 nS, wGIp = 0.6 nS, wIRa = 4 nS. wGR = 15.6 nS is used in all cases. Other parameters correspond to default values. Note that the depicted IN response does not apply to case (RC-i) as the IN is only synaptically activated at the triads in this case as wGIp = 0. Note also that 500 trials, not the default value of 10 trials, were used to compute each depicted trial-averaged spike-count rate, and that no seven-point filtering was employed to smooth the area-summation curves.

